(Note: This blog post was originally published under my old domain(codesmiles.com), here. Web Archive link.
(This post is part of my Visual Studio 2010 series)
This article talks about Visual Studio 2010’s new features related to debugging, applicable from beginner to expert(based on Visual Studio 2010 beta 2). Visual Studio 2010 comes with powerful debugging features. Debugging is an area where an improvement brings great relief to developers, and increases developer happiness. Visual Studio 2010 seems to highly enhance debugging support, and can change some basic ways we used to debug applications, let us have a look.[more]
Export/Import Breakpoints
By using Export/Import breakpoints in Visual Studio 2010, you can debug a portion of the application and export the current set of breakpoints and import it back whenever you want to debug the same portion of application, no matter what breakpoints you have currently placed in your code. This feature will enable you to have different set of breakpoints for each scenario or portion of application that you may need to debug. This is one of the features that I highly wished to have.
An example scenario… consider your web page/windows form has basic CRUD(Create/Read/Update/Del) options, you are currently working on “Create” part. When executing if you get unexpected results, you will set up several breakpoints and debug, then you proceed to code “Update” part.
Now, when you need to debug “Update” part you mostly clear/disable all breakpoints you just set and create new breakpoints. But what if you get some new error in Create part again? you have to clear/disable all break points, and again go to different locations, set breakpoints and debug the Create part.
This example is not complex, but think of all those complex scenarios you may have debugged for hours; switching one scenario to another.

Choose Debug->Windows->Breakpoints and Export/Import breakpoints as indicated above. Breakpoints will be exported as a file in the location you choose and you can select this file when you import.
Stick the DataTips
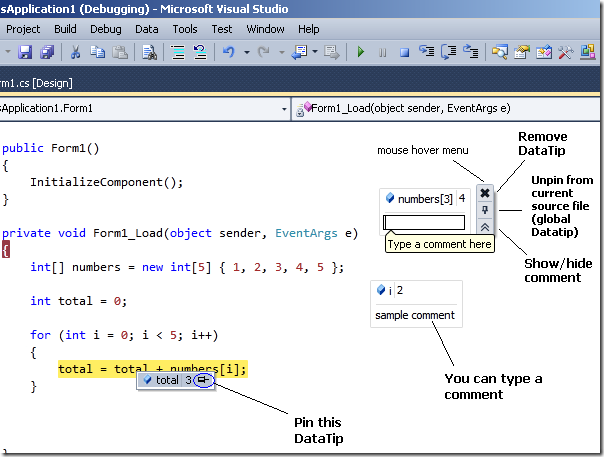
You know that, while debugging, we can hover our mouse over a variable/object and inspect, edit & explore it and we call this as DataTip. In Visual Studio 2010, we can stick DataTips to our code window and drag & drop to any location and the DataTip will hang there. This new feature gives pretty easy view to monitor the variables that matters for your current debugging.
Pin, Unpin(delete), add comment
You can click the pin icon next to a variable’s DataTip and it will stick to your code window for you to drag & place as you like.
You can remove it by clicking the “X” in the DataTip mouse hover menu.
You can add comments/notes for a variable by clicking the double down arrow in the DataTip hover menu.

Unpin from a single source and make it available in all source files
By default the DataTip will be pinned to current source file, if you want the variable/object on other source files too (in page1.aspx.cs, page2.aspx.cs, etc) then you can click the unpin icon in datatip hover menu. You may do this for global objects.
Export/Import DataTips
As I explained in Export/Import Breakpoints, we can export/import DataTips too, in the same way in Visual Studio 2010.
More on Datatips…
If you pin(stick) the elements of same array(a[1],a[4]) it is automatically placed as a group.
Update: Just noted that there is no mention about Intellitrace feature(historical debugging) in this post, I didn’t include this previously because of few reasons.
Intellitrace (Historical Debugging)
IntelliTrace is a feature previously known as Historical debugging, which is a major enhancement made to the Visual Studio 2010 debugger. When an exception occurs, you usually start debugging with breakpoints set in suspected areas and check variable/object values for correctness.
But if an exception occurs when IntelliTrace is enabled, it allows you to just go back in time of your application execution and find out what events got raised and what were the values of various variables, etc similar to Call stack like approach. This helps you inspect all the events that finally triggered the exception. This helps in many ways, even you don’t need to worry about breakpoints.
Update: I have written an article on IntelliTrace here
Conclusion:
I am sure these new features of Visual studio 2010 would have excited you as it did to me. These tools help speed up debugging. I take this opportunity to encourage you to highly utilize these wonderful changes that are going to be available in Visual Studio 2010. (Update: Visual Studio 2010 final product is released on April 12, 2010).
Please Note:
This article discusses about only Visual Studio 2010’s new features that will get immediately noticed by majority of the developers, and features that will be used by all kinds of developers using Visual Studio, hence I ignored some options related to specific category of developers or options that are advanced, or minor differences that might Not get noticed as “new features”, things I didn’t cover includes – parallel computing, new menu/context-menu options, etc. The article keeps beginners and Non-native English readers too in mind.
Also, as I have posted this blog entry as article in CodeProject too, you may notice style difference.